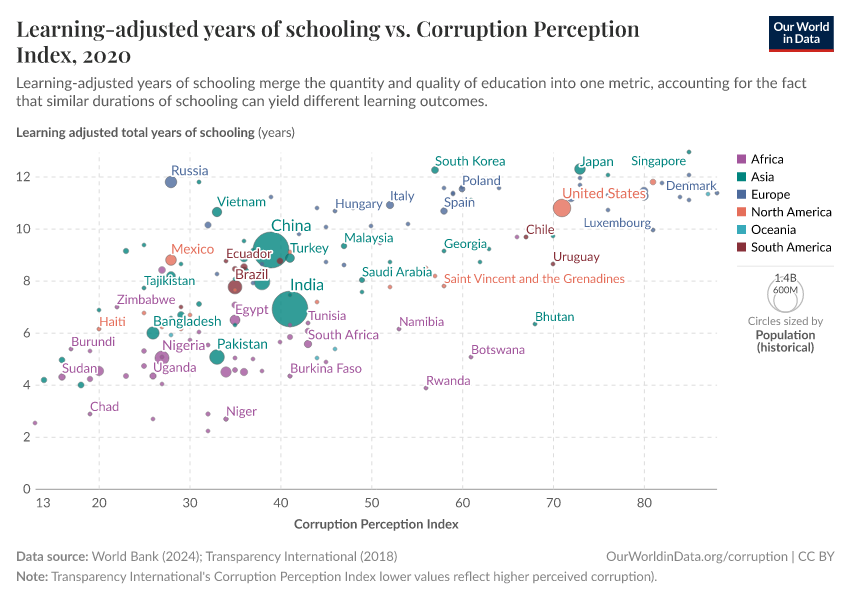
Interactive visualization requires JavaScript
Related research and data
Charts
- Average rating of perceived corruption in public sector
- Bribe payers index
- Bribery incidence for firms
- Bribery prevalence
- Bribery rates
- Corruption Perception Index
- Corruption Perception Index vs. share of people who have bribed
- Government transparency
- Human Development Index vs. Corruption Perception Index
- Incidence of bribe requests, private sector
- Perception of corruption by institution
- Political corruption index
- Share of people who think political parties are very corrupt
- Unpaid parking violations per diplomat in New York City by country of origin